London Cycle Statistics

TfL has aspirations of 5 percent of all journeys in London to be made by bicycle by 2020 and to his end they have installed sensors which detect bike movements. Little information is given on the nature of these measuring devices other than that they measure a distortion of an electromagnetic field.

TFL aren't publishing the actual number of bike journeys (as presumably there is no way to easily measure all bike movements) but have released indexed figures on a monthly basis. When I say monthly, It would be more appropriate to say on a four week basis, as TfL like for each reporting period to have the same number of days, so they have 13 reporting periods.

Looking at the data, it's clear that cycling is increasingly popular. The chart below shows the relative increase in cycling (ignore the scale, it's meaningless) for every year since 2000/01, with the number of bicycle journeys annually about two and a half times higher in 2012/13 than in 2000/01 - clearly a decent rate of growth.

Similarly, looking just at "period 1" (April 1-28) for each year we can see a steady upward trend - for year-on-year comparisons of individual "periods" there are blips, but its likely that weather affects matters.


However, if we plot the relative number of journeys in every 4 weeks "period", we can see there is significant seasonal fluctuation. What'ts more striking for me is that the variation appears to also be growing over time (if we look at the range between each peak and subsequent trough).


I applied a seasonal adjustment to try and iron out this level of variation to try and get a better idea of what the trend was and this is shown by the red line in the chart below. However, by applying this adjustment, I've actually increased the level of variation in earlier periods, as the adjustment appears to overcompensate. The two black lines on the chart are the trends for period 8 (October) - what I'm thinking of as the end of temperate weather and period 10 (mid December-mid Jan) which I think is a good marker for height of winter (shortest days, cold, wet etc).

Looking at the two trend lines and the datapoints, we can see very divergent trends for the numbers of journeys in these periods, which emphasises the very seasonal uptake in cycling - whereas in the past the number of journeys each month was relatively steady, the real profliferation in cycling has been in warmer months. Basically, London has a large population of fair weather cyclists who don't appear to like to stick it out in the cold, dark and wet months. 


Now, clearly as the number of journeys increases, we would expect the absolute diference in the number of journeys in winter and summer to increase, but not necessarily the relative difference. Whilst summer cycle journeys have nearly tripled, our 'winter' journeys have increased by about 50% - not an unimpressive figure, but if we want a year round modal shift in journeys, work needs to be done. In the TfL data there are some comments about weather and 'coldest January ever' etc, but it's difficult to consider these statistically. I am looking for some decent London weather data.

To consider this high variability period-on-period, I have calculated a 13 period rolling co-efficient of variation for the preceding 13 periods- basically the ratio of the standard deviation compared to the mean. Because the co-efficient it is 'dimensionless' when looking at trends, we don't need to worry about the fact that an increase in journeys would most likely lead to an incrase in variance/standard deviation. We can see that the level of variation has definitely increased over the period. Interestingly though, the largest spikes in variation were in 2004 and 2005 and I don't know what drove this.
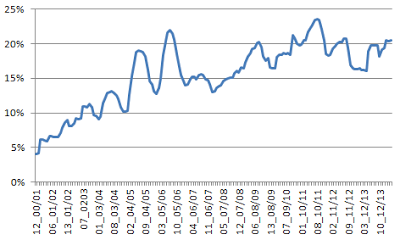

Co-efficient of variation (rolling, previous 13 periods)

What is particularly interesting is there are no sizeable increases that match particularly well to issues like the 7/7 bombings, opening of cycle super highways or even Boris Bikes - there is jus ongoing increase. I have another dataset on Boris Bike usage, and I'll be looking at this in greater depth.

So, in conclusion the data shows more journeys are being made by bike in London, but a large number of new cyclists don't don lyrcra with equal frequency through the year.

Do it yourself

When we bought our house, we also inherited two MDF shelves, stacked into a low bench, which at some point became our shoe rack. @potoft decided this didn't quite fit into her vision for the aesthetic integrity of the house. So, she bought a few baskets with lids to go on the 'bench' to try and make things a little tidier. For some reason, I found myself volunteering to make a new unit.

So, starting with the need to house 4 baskets, I started sketching some ideas - the principal constraint being avoiding blocking vents on the wall heater.


However, the baskets @potoft had bought had hinged lids on so, she wanted at least two of the baskets to be easily accessible, so I redesigned, having a hinged wooden lid instead.
In the end I went with something a little bit more simple. Using my B&Q branded square I measured out my pieces- two sides, two shelves and some bracing batons.


To save me developing tennis elbow, or some similar ailment I opted to use my jigsaw rather than a tenon saw, sacrificing a bit of stability, predictability and precision for speed and ease.


To maintain a straight sawing line, I used a baton, held on with some G-clamps, parallel to my cutting line to allow the shoe of the jigsaw to follow the straight edge.

The trickiest bit was putting on a curve on the corners, to try and make the unit look less boxy. Ideally I would have used a router to put some detailing onto the edge, but alas I don't own a router, and for this project, it would be uneconomical to acquire one.

I was making this project using laminated pineboards (strips of pine glued together), which I discovered is not the easiest material to saw, as each strip behaved differently with the saw, and the glue holding the strips is also quite tough. I achieved the curve by using several straight lines, gradually building up a curve. Once I had done one side of the shelves, I flipped the board over onto the other side and used it as a template.

As a relatively simple unit, I decided not to bother with dowels to hold the unit together, using slightly less professional fixing blocks. Working out where I wanted the top shelf, I made a mark and measured 18mm (the thickness of my board) below.

Again, using my square I marked off a line and rested my fixing blocks on the line. I then drilled pilot holes for the screws using a small drill bit.


Using 1", 6 gauge screws, I then attached the blocks to the sides before going on to screw into the shelves directly (very naughty, but the pine was sufficiently giving, and I tested this on a bit of offcut) - saving me having to measure out and drill pilot holes.

At this point, I should point out that DIY is readily improved by the provision of birthday cake.
However, some folk such as this squirrel don't have an assistant to bring them cake, so whilst this squirrel watched me beavering away, he was helping himself to some of my nuts.

My nearly completed unit is shown below - I've sanded off the curves, but the wood needs varnishing or painting, and we will be putting a little gingham curtain across the bottom level to conceal the shoes on the bottom, which will be held up with curtain wire hidden behind a narrow baton. (I will also be disposing of the  off cuts on the left of the photo!)


New Tesco Express for St Katharine Docks

My periodic trawl of the Tower Hamlets Planning database reveals that a Tesco Express is coming to St Katharine Docks. You can see the documents on the LBTH database here. As a reminder, I have developed a Wapping specific extract of the database available on this blog here, which is an easier way of checking on local applications, for numerous reasons.

The store will be on St Katharines Way, in  the former 'The Dog House' Bar, on the south west corner of the docks. The West and South Elevations are shown below.


Whilst Tesco might not be everyone's cup of tea, or preferred choice of occupant, one upside is an additional cash machine, which may benefit independent traders as I have on occasion found the cash machine by Starbucks to be out of money.

The big question for some will be whether the length of queues at Waitrose in peak hours are going to be affected. A bigger question is whether the new cafés in the Docks will be affected.

Wapping Woods

With the report of a robbery in Wapping Woods at the Weekend (a shout out to my good friend @olopoto for sharing this info with residents), personal safety in Wapping has again become a hot topic, to the extent I even heard my next door neighbours discussing the attack, which makes a change from football and toddlers.

In his response, LoveWapping quoted  minutes from the Police Ward panel held on 24th April. There were two interesting nuggests of information.

The first:
"Robbery – there have been 2 robberies through Wapping Woods where an arrest has been made.  Since the arrest there have been no more robberies in this area."
It's not fully clear what period these two robberies occurred over but it seems likely to be March and April, based on other references to numbers of crimes in those months and the fact that the meetings appear to be every other month.

The second nugget was that:
"Wapping ward is in the top three safest places to live in London according to crime rates and ASB reported to the police."
I am now pretty certain that this is not factually correct, unless there is some particular qualifying factor on the analysis, such as "2-4pm on that last wet wednesday, when the phone wasn't answered", and I think it's rather misleading - I discussed this claim in a previous post where I found the ward was actually the 402nd safest ward, not including ASB, in London. However, I have also written at length that safety is an emotion, or a feeling and not a statistic.

In my thoughts about crime and safety, I often return to Wapping Woods. Recently I've been walking through twice a day, to and from work. I've never felt unsafe or uncomfortable, but @potoft, my partner in crime (?) has been feeling increasingly uneasy. I noted recently to @potoft that as the trees become covered in leaves the light and the feel of the woods changes.

I have come to the conclusion that the woods are particularly ill designed given that there are both east-west and north-south pedestrian routes crossing through them. I don't know what would improve safety other than chopping the trees down, but I wondered if the Woods were actually any less safe than other parts of London, or Wapping.

The conclusion

Starting with the null hypothesis that crimes occur with equal likelihood in any given square metre of either Wapping, LBTH or London, the fact that two robberies occured in Wapping Woods in two months proves that this is not the case. I found that for the underlying number of  robberies in Wapping, there is a 0.2% probability that two robberies would have occured in an area the size of Wapping Woods, suggesting that in those two months users of the Woods were statistically more exposed to the risk of robbery, or more specifically - we would not expect this level of crime purely at random, if crime was equally distributed. Only if our basis of analysis was using LBTH crime levels and we double the relative size of Wapping Woods is the finding not significant at the 95% confidence level. However, the police report suggests that this blip was due to one individual's actions. If this is the case, then a look at longer term levels of crime is necessary. I don't know if this will be forthcoming.

In reality a myriad of factors interact to make crime more or less likely to occur in different places and I can't control for these. I know and accept that my analysis isn't fully robust, but it does approach the situation rationally and without emotion, it avoids anecdote and relies on facts. What it does tell me, is that more work needs to be undertaken by the police and community to reduce the dangers of this area.

The Boring Bit

For this analysis, I'm using the Poisson distribution, which expresses the probability of events occurring in a fixed period, independent of when the last event occurred. When the distribution is plotted, its a broadly bell shaped curve.

Where this analysis differs from some I've done previously, is thinking about the probability of a given level of crime occurring in an area, rather than the number of crimes recorded.

So before we start. A few points:
  • I'm looking only at robbery (ie theft from a person)
  • I'm including robbery of both personal and business goods
  • In the 24 months to March 2013, there were 71,536 robberies across London, or 2,980.7 per month
  • In the same period there were 44 in St Kats and Wapping, or 1.83 per month.
  • For all of LBTH the figures are 2,703 and 112.6
  • The area of St Kats and Wapping is approximately 11.4 square kilometres
Using this information we can calculate the probability of different numbers of robberies across all of Wapping, using the average number of robberies for the preceding 2 year period. I then go on to think about the likelihood of 'x' robberies occuring in an area the size of Wapping Woods.

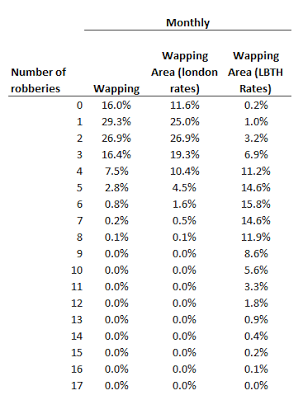
The first table shows the probability of a given number of robberies having occurred in a given month anywhere in St Kats and Wapping, based on a) number of robberies that occurred in St Kats & Wapping in the last 2 years b) the number that one might expect in Wapping if robberies occurred with equal frequency across all of London and c) the number in Wapping based on LBTH robberies. The final two calculations are based on geographic area, rather than the number of people (so if LBTH is 10 times the size of Wapping, I divided the LBTH figure by 10 to get the equivalent Wapping figure).

So based on Wapping's underlying number of robberies, there is an 84% (100%-16%) chance of at least one robbery. Using London and LBTH rates, this figure increases to 88.4% and 99.8% respectively. LBTH rates are considerably higher on the basis of geographic density of crime, which is likely linked to its much greater population density than Wapping and London as whole.


Looking at what we would expect from an area the size of Wapping Woods, I calculated the Woods to be around 18,000 square metres, or 0.02 square kilometres. Wapping is 1.14 square kilometres. Now assuming that crimes occur with equal frequency on any given bit of land, we can try and calculate what the probability of a robbery occurring in a piece of land of the area of Wapping Woods. What we find is that based on Wapping's number of robberies, is that there is a only a 2.8% probability of a robbery in Wapping Woods in a given month, but based on Tower Hamlets as a whole, the probability increases to 9.1%.


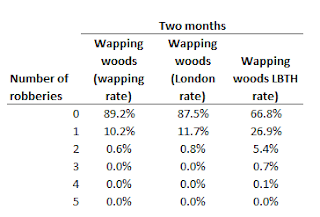
If we consider the likelihood of different numbers of robberies occurring over two months (which is what we have information for from the minutes), the probability of a larger number of robberies occurring, intuitively increases.

Similarly, looking at the Wapping Woods area, the likelihood of 2 or more robberies occuring in the Woods is between 0.2% and 1.8%. Clearly, the probability of two robberies occuring at random in an area the size of the Woods is very low, suggesting this isn't something that would happen by chance.

However, there are some flaws in my model - in real life I assume robbery is likely to occur outdoors rather than indoors (at which point it may become classed as burglary, other than in say shopping centres), whereas this model doesn't distinguish between relative areas of indoors/outdoors/private/public; therefore I acknowledge using a method based on total area without adjusting for buildings may distort results. To assess the sensitivity of my findings, I have doubled the estimated size of Wapping Woods to make it account for a greater proportion of the area of Wapping. However, even with this, assuming robberies occur with equal likelihood anywhere in Wapping, in a two month period, there is only a 0.6% probability that two or more robberies would have occurred in this period and even with the crime rate of LBTH, there is only a 6.2% probability of two or more robberies occurring in the Woods in this period. So at the 95% confidence level, this speight of robberies is not what we would expect in Wapping or London as a whole, but might be consistent with Tower Hamlets. If data was available for a longer period for the number of robberies in the Woods we would have a clearer idea. However, it seems that the Woods was certainly accounting for a disproportionate number of robberies in the area in those two months.

To Hampstead Heath with a Heron


'You are so British, you see that and you sit down! In Rome if they saw such a thing on the Metro they would be "ooh look at that! Have you seen that? Come and look at this"'.
 
So came the response from an Italian colleague of mine, as we had a coffee in Carluccio's in Hampstead, as I told her about our trip on the Overground from Wapping to Hampstead Heath.
Apparently, the Roman and London attitudes differ on matters of the surreal, though once you live in London long enough, the surreal becomes commonplace. My understated response reminded me of a quote from the Sherlock Homes story, The Red-Headed League:
 

“As a rule,” said Holmes, “the more bizarre a thing is the less mysterious it proves to be. It is your commonplace, featureless crimes which are really puzzling, just as a commonplace face is the most difficult to identify.”

 
(As an aside The Jeremy Brett TV adaptation of the Red-Headed League should be commended for an appearance by Richard 'I can't believe it' Wilson with a fine head of ginger hair)
 
I'm often amazed by outfits I see people wearing in London - the trend for rolled up skinny jeans, no socks with shoes and a set of waxed moustaches that would make Poirot envious is a case in point. British people are meant to be good with irony, or so we tell ourselves when criticising American comedy (which is presumably why we ended up with Miranda). I think that some element of the hipster outfit is meant to be ironic but I'm not quite sure which bit. Amazed in that I don't know at what point you decide to become a hipster, or how it happens. I know that it's too late for me, for one thing, I don't have calf muscles that would fit in a Pringles can, or more importantly in skinny jeans. To be quite frank a lot of my jeans could be described as tight fitting, but not over the entire length of my leg. For many men, skinny jeans (or if people are honest, basically jeggings, the route of pure evile) are an appropriate fashion choice, a link to their spiritual icon, Errol Flynn as Robin Hood, whereas for me, it would be less Errol and more error.
 
So, when I boarded the Overground and was faced down by a heron in a glass case I was somewhat taken aback. The Wapping Wildlife patrol often see 'Mr Burns' around the area, but I don't think they've ever seen him on the Overground. However, my surprise quickly subverted itself physically into an eye-roll. The heron's escorts were of the hipster persuasion.
 
By the time I was plucking up the courage to ask them about the provenance of the heron (it was already on the train before it got to Wapping), they departed at Dalston carrying it, and their secret with them. Should anyone ever want to write an amusing Brit Flick, they could do worse than writing the story of the underground railway that transported taxidermied animals under the Thames.


Yet, the commonplace part of my day, meeting up with a friend and her husband and baby to have a picnic, was particularly enjoyable. A brief stroll through part of Hampstead Heath (which for some reason I had not visited previously), and a pleasant repast, something that is so common for so many, but not puzzling to understand why it was a nice relaxed way to spend my weekend.


Wapping Music Videos: Ghost Town by the Specials

Part of a series of music videos filmed in Wapping.

Ghost Town, by everyone's favourite Coventry 2 tone ska revival band the Specials, spent 3 weeks at number 1 in 1981. The video shows the band driving around Wapping, Southwark and the City in a Vauxhall Cresta. A nice reminder of what Wapping High Street looked like before the new blocks of flats were built.


Fast Facts: Ambulance responses to binge drinking in Tower Hamlets

The first in a series of shorter posts looking at specific bits of data. Today's data is a look at ambulance callouts for the London Ambulance service 2009-2013.

Chart 1: Looking a the number of ambulance callouts over the period, we can see graphically a broad increase of around 30 incidents a month over the period. However, the data fluctuates quite a bit month on month. R2 on this is 0.26, which gives R, the correlation co-efficient as being 0.5. Given the number of observations, this means that theres is a less than 5% likelihood that the observation that binge drinking callouts increase with time is random.


Chart 2: If we apply a seasonal adjustment factor based on which month of the year a data point occurs in, to control for differences in drinking at different times of the year (people might disproprtionately drink in say December or summer months) the R2  increases to 0.4, and an R of 0.63. The application of the adjustment, removes some of the month-on-month fluctuation in the data and shows more clearly the increase.


Conclusion

Binge drinking related ambulance callouts are on the increase in LBTH. However, we can't say with any certainty if this reflects a growth in population, an increase in binge drinking or an increase in how likely someone is to call for an ambulance for themselves, a friend or someone comatose in the street.


Popular Posts